 SUMMARY:
The correlation between GDP (Gross Domestic Product) and electricity demand is one of the most fundamental relations. However, it is important to understand the dynamics of this relationship for different subsectors. Not all economic growth is the same, similarly, increase in energy demand caused by economic growth wouldn’t be the same. In this Q report, the correlation between electricity demand and economic subsectors of GDP (agriculture, manufacturing, service and public sector) will be analyzed. The question is, how the relationship between these sectors and electricity demand changes over time.
METHOD:
Multiple sources were used in this Q report:
- Monthly electricity production data is obtained from TEIAS website (old data, 2017 data),
- Exchange rate data are obtained from the TCMB electronic data system
- GDP data are obtained from TUIK website
R worksheet on Microsoft Azure platform was written for 12 month moving correlation. GDP in current prices terms was then converted to US dollarsusing currency rates. Converting the data to constant TL or US dollars is not conducted for this analysis.
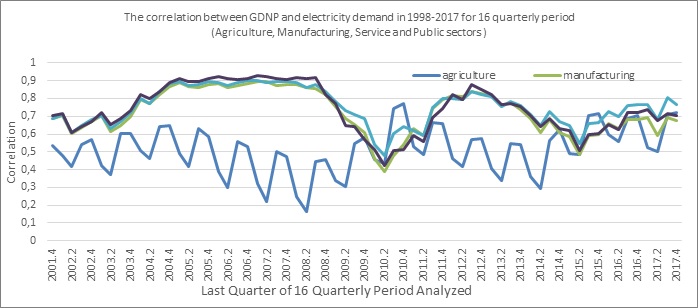
In Figures 1, 2 and 3, the correlation between the relationship of electricity demand and GDP is shown for periods starting from 2001Q1 to 2017Q4.
Correlation for each period represented in the x-axis is calculated by considering the relationship between sector growth and electricity demand for the corresponding last 16 quarters(4 years). This is why, correlation rate for the 4th period of 2001 (2001.4) measures the relationship for the period“1st quarter of 1998 – 4th quarter of 2001”. When this number is equal to 1 it shows that they move together in the same direction, when the number is equal to -1 it means the opposite while 0 means that they are uncorrelated.
ANALYSIS:
In Figure-1, subsectors with highest share in GDP, agriculture, manufacturing, service and public sectors are analyzed. Seasonality of agriculture sector can easily be observed.
When the analysis is done in Turkish liras with current prices, positive correlation with increasing electricity demand would be expected.
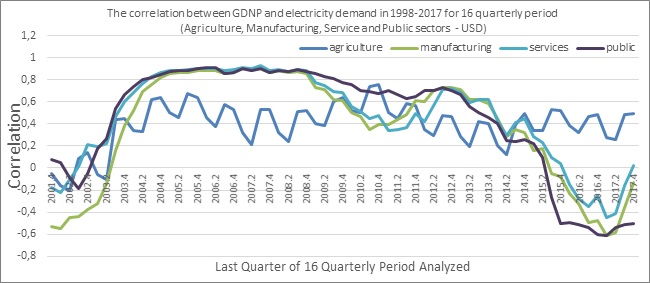
In Figure-2, correlation between electricty demand and GDNP in the subsectors are shown in terms of quarterly US dollar/TL rate taken from CBRT.
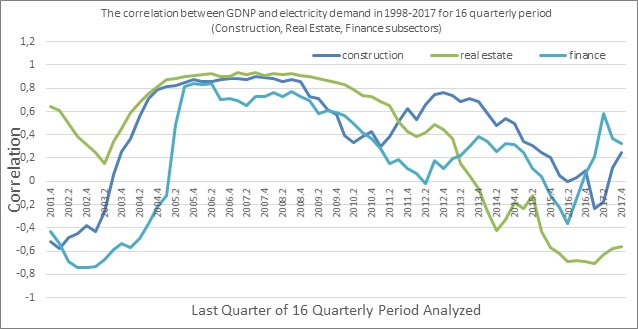
In Figure-3, correlation between subsectors (finance, construction and real estate which are considered to be interlinked) and electricity demand is analyzed.
CONCLUSION:
Graphs can be analyzed as follows:
- At the very left of the graphs effect of 2001 economic crisis can be observed.
- It is observed that in Turkey since 2017, correlation between main sectors and electricity demand is continuously increasing.
- In real estate sector, increasing correlation is not as strong as in the other sectors.
- In construction sector, positive correlation is observed for the last 15 years, with an exception of a short period starting from end-2016.