 SUMMARY:
Just because solar data is not available on an hourly basis does not mean that it cannot be obtained from existing published data. How that data is to be interpreted is a separate matter. Therefore, the title of this Q report is not the effect of the solar power plants, but the effect of the sun. Beyond electricity generation, a sunny day affects the use of boilers, natural gas consumption, amount of lighting and electric heating consumption, depending on the temperature. In this report, we will briefly discuss what sun’s effect is.
METHOD:
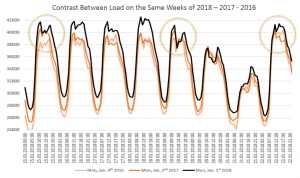
Firstly, monthly installed power figures from TEİAŞ and licensed production quantities and unlicensed solar production prices from EPİAŞ Transparency Platform were reviewed. Then, the days with the highest difference/decline at noon according to the actual consumption curves were studied on a weekly basis. In theory, if the solar production at noon is high (because this generation is more dependent on the distribution), it will have to take over its share from the generation offered from other producers and should reflect as a decline. Significant declines were observed in production and consumption around noon, especially on 15 – 19 January 2018. These numbers were compared first with the same hours of 2016 and later with 2017. In a similar way, the load curves were overlaid on top of each other and load curves were bent with offset. Both methods were left to the readers’ discretions.
As the same days of the week were compared instead of the same calendar days, the 2016 data started from January 4, the 2017 data started from January 2 and the 2018 data started from January 1. These three dates point to first Mondays of the year.
ANALYSIS:
Why January was chosen and not summer months? Because according to TEİAŞ data, the installed unlicensed solar power, which was 819 MW in July 2016, reached 1349 MW in July 2017 and 3613 MW in December 2017. In order to have meaningful results, year to year changes must be substantial. Year-on-year 2000 MW capacity increase could offer this significant difference, emerged this year. For this reason, the sharp decline points in January and the notable situation on January 22 were examined.
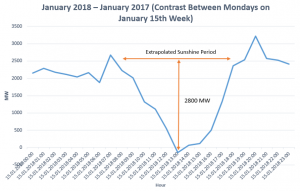
After running several different methods, January 15 and January 19 were examined specifically. With a simple operation 2017’s demand was subtracted from that of 2018. The difference between Monday, January 15, 2018 and Monday, January 16, 2017 could easily be observed.
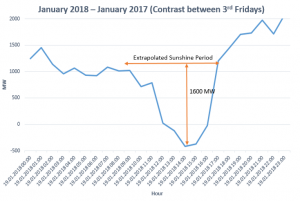
Another is the difference between Friday, January 19, 2018 and Friday, January 20, 2017. Here the sun probably showed itself later in the morning and then was quickly obscured.
CONCLUSION:
We will start to see more and more “sun holes” in the afternoons this year. Although current electricity consumption data and other data on sunlight are not provided separately, days that are highlighted with this effect can be combed out by comparing previous years. This report cannot give solid estimates on solar production because sun’s heating effect can impact an entire energy regime just as it was the case on January 22, 2018. The change on the 15th and 19th January 2018, shown above, seems likely to be greater than it should be. We cannot know for sure until the data becomes available. Once it does, a distinction between the net load and real load in Turkey will be inevitable.