 SUMMARY
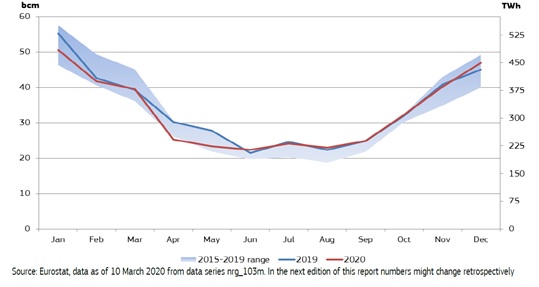
As Figure 1 below shows, in the fourth quarter of 2020 gas consumption in the EU was similar to that in Q4 2019, with the exception of December, when it was slightly higher, close to the upper range of the last five years. In 2020 gas consumption in the EU amounted to 394 bcm, down by 12 bcm (3%) compared to 2019.
Figure 1- EU Gas Cunsumption
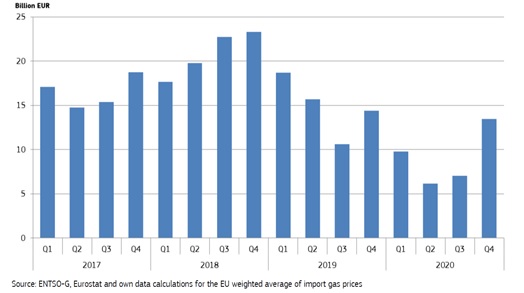
Due to the combined impact of year-on-year decreasing import volumes and increasing average import prices, in the fourth quarter of 2020 the estimated gas import bill amounted to €13.5 billion, (in comparison to €14.4 billion in Q4 2019, falling by 6% year-onyear).
Wholesale gas prices in Europe, following the recovery started in the previous quarter, were up by 5% in Q4 2020 year-on-year. The quarterly gas import bill however rose significantly in Q4 2020 compared to the previous quarter (€7.1 billion). In 2020, the total gas import bill was €36.5 billion, down from €59.4 billion in 2019.
Figure 2- Estimated Quarterly Extra-EU Gas Import Bill, in Billions Of Euros
Key findings in the report are as follows:
- In spite of new lockdown measures in many EU countries and other parts of the world, in Q4 2020 energy markets, including natural gas and oil markets, were generally in positive mood and followed an upward price trajectory over the quarter. As of early November, this was reinforced by news on the availability of anti-Covid-19 vaccines, which raised expectations of the end of the pandemic crisis and recovery, implying rising demand for energy products. GDP in the EU was still down by 4.6% in Q4 2020 in year-on-year comparison in the EU.
- In the fourth quarter of 2020 EU gas consumption went up slightly, by 1.3% (1.5 bcm) compared to Q4 2019, after the 10% fall in the second quarter and stagnation in the Q3 2020. Consumption of gas was limited by relatively mild weather in Q4 2020, however, the widespread practice of teleworking might have contributed to the overall increase, in the residential sector. Gas consumption in Q4 2020 was 119.2 bcm, up from 117.7 bcm in Q4 2019. In 2020, consumption of natural gas amounted to 394 bcm, down from 406 bcm (by 3%, and 12 bcm) in 2019.
- Indigenous gas production in the EU, amounting to 14 bcm in Q4 2020, was down by 15% (2.4 bcm) compared to Q4 2019. In Q4 2020 the Netherlands produced 6.2 bcm of gas, down by 17% year-on-year. The Dutch government announced that the production cap for the Groningen field is going to be halved compared to the current gas year as of October 2021. Romania produced 2.4 bcm of gas, followed by Poland (1.5 bcm) and Germany (1.1 bcm). In 2020, gas production in the EU amounted to 54 bcm, down from 70 bcm in 2019. The United Kingdom produced slightly less than 40 bcm natural gas, whereas production in Norway amounted to 112 bcm.
- EU net gas imports fell by 9% year-on-year (8.8 bcm) in Q4 2020. Russian pipeline supplies covered 49% of extra-EU net gas imports. Norwegian pipeline gas was the second most important source (22%), LNG imports together covered 18% of the total EU imports followed by pipeline imports from Algeria (10%) and Libya (1%). Net gas imports amounted to 84 bcm in Q4 2020, while in 2020 it reached 326 bcm, down from 358 bcm in 2019. If pipeline and LNG supplies are also taken into account, in 2020 Russian gas ensured 48% of the total extra-EU imports, followed by Norway (24%), LNG from non-Russian, Norwegian and Algerian sources (18%), Algeria (9%) and Libya (1%). In 2020, the total gas import bill was €36.5 billion, down from €59.4 billion in 2019.
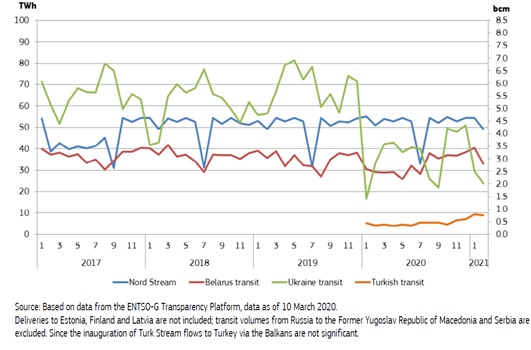
- Nord Stream remained the most important supply route of Russian pipeline gas to the EU in Q4 2020, having a share of 37% in the Russian pipeline imports (15 bcm transit), the Ukrainian transit route re-emerged to the second place (34%, 14 bcm), and the Belarus transit came to the third place, with 25% (10 bcm), ahead of Turk Stream (4%, around 2 bcm). In 2020 52 bcm gas was transited through Nord Stream, around 38 bcm gas was transited through Ukraine with EU destination, 33 bcm though the Yamal pipeline (Belarus) and only 5 bcm through the Turk Stream. Decrease in EU Russian gas imports mainly impacted the Ukrainian transit route.
Figure 3- EU Imports of Natural Gas from Russia by Supply Route, 2017-2020
- The new Trans Adriatic Pipeline, being part of the Southern Gas Corridor and providing access to Azeri gas sources, began operations in November 2020 and the first gas shipments were delivered to Italy on 30 December 2020. The pipeline is to deliver 10 bcm gas per year, principally to Italy, Greece and Bulgaria. The importance of Turk Stream is to increase in Russian gas supply to the Balkans, as the new Bulgaria-Serbia gas interconnector became operational since January 2021.
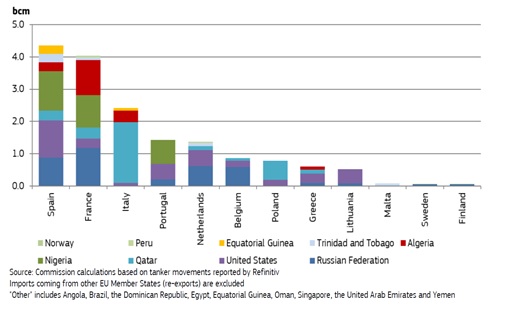
- EU LNG imports fell by 27% year-on-year in Q4 2020, owing to increasing Asian wholesale gas market price premiums to Europe, which resulted in cargo redirections towards the Asian markets. Russia, the US and Qatar had almost equal shares in the extra-EU LNG supply (17 bcm). In 2020, the total EU LNG imports amounted to 84 bcm, down from 88 bcm in 2019. The biggest EU LNG consumers were: Spain (21 bcm), France (20 bcm), Italy (12 bcm), Netherlands (8 bcm) and Belgium (7 bcm). The United States supplied 19 bcm of LNG to the EU, followed by Qatar (18 bcm) and Russia (17 bcm). In global comparison the EU was the third biggest LNG market after Japan (102 bcm) and China (91 bcm) in 2020.
Figure 4- LNG Imports in the EU Member States From Different Sources in the Fourth Quarter of 2020
- Gas traded volumes on the European hubs was up by 21% (plus 3 439 TWh) in Q4 2020 year-on-year, after the temporary decrease in the previous quarter. In spite of falling LNG imports, storage withdrawals intensified and trading volumes were mainly driven by near-curve contracts on the European hub optimising seasonal storages and hedging for international players. The Dutch TTF remained the most liquid hub in Europe, pooling around three quarters of all European gas trade.
- Gas storage levels in the EU fell to 74% by the end of December 2020, which was 21% lower than at the beginning of Q4 2020, as higher spot market prices increased the competitiveness of consuming gas from storages, injected at lower costs.
- Spot prices on the European gas hubs in Q4 2020 kept on increasing and were 6-21% higher in year-on-year comparison. By the end of December 2020 the TTF spot price rose to 19 €/MWh, the highest since the beginning of 2019. As during the course of Q4 2020 the price premium of the Asian wholesale gas markets widened to Europe, reaching the highest since the end of 2018, LNG cargoes were redirected towards the more lucrative Asian markets, reducing gas supply in Europe and propelling the EU wholesale market prices.
- Retail gas prices for household customers showed a decrease of 8% year-on-year in Q4 2020, while industrial customers faced a decrease of 2% in the same period. With the exception of seven countries, gas prices for households in European capital cities were lower in February 2021 compared to a year earlier.
- Hydrogen costs base assessments show that in the Netherlands production costs of hydrogen with alkaline electrolyser technology amounted to 118 €/MWh in December 2020, whereas with polymer electrolate fuel cells the cost was assessed to 99 €/MWh, and with steam methane forming at around 48 €/MWh, if capital costs are included as well.
Source: “Quarterly Report Energy on European Gas Markets”, European Commission