 SUMMARY:
Wind’s chilling effect depending on its direction means it has an amplifying effect on heating demand and natural gas. In electricity generation on very windy days, natural gas plants may not be able to operate at full capacity due to low prices. In other words, the blowing wind may increase household demand on one side while decreasing demand for natural gas for the electricity on the other. This interaction between depends also on other factors such as hydraulic production in the system and imported coal prices. In this Q report, we will examine the relationship between natural gas demand and wind starting from December 1st, 2017. We will also touch upon the impact of the 1000 MW solar and wind capacity increase on the natural gas network.
METHOD:
Daily natural gas statistics are being published since December 1st, 2017 at BOTAŞ EBT. Wind and total electricity production data was derived from EPİAŞ Transparency Platform. Natural gas day of December 1, 2017 starts at 08:00 on December 1, 2017 and ends before 08:00 on December 2, 2017. Hence, the total electricity generation and wind production figures for the gas day were calculated from the hourly electricity data. The correlation between the wind ratio and natural gas demand was studied using Excel. A histogram of the daily change of the wind was deduced, and then compared with pipeline inventory figures and changes.
ANALYSIS:
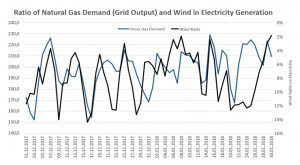
When we look at the share of natural gas demand and the share of wind in electricity production on the same graph, (if we draw the wind’s share on electricity on the secondary axis reversed, on a decreasing upward direction) it reflects a reverse relationship. The natural gas extraction from the grid increases as wind’s share on electricity generation decreases.
Taking a 53% efficient natural gas plant as basis, a wind turbine of 1 MWh causes a decrease equivalent of 177 m3 on natural gas demand in the system.
In the period from December 1st, 2017 to January 30th, 2018, the wind production was slow to make room for natural gas. In other words, electricity production from the wind has seen rapid production increase and slow production decrease. This reaction is also seen on the frequency graph.
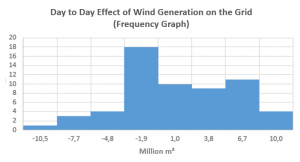
Wind generation in this period has provided a support equivalent of 11 million m3/day worth of gas entry to the natural gas grid on average. If we focus on the relationship between natural gas demand and wind, the following conclusion demonstrated on the chart can be driven.
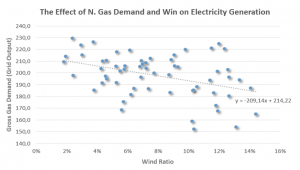
Consequently, wind supply security has become an important element in the winter period. If we take this winter period as the base and factor in sun’s effect (previously shared on Q12) it is not far – fetched to conclude that 1000 MW of wind contributes 1.7 million m3/day and 1000 MW of sun contributes 1 million m3/day to the grid for every winter period where wind is at a medium strength and skies are clear. Whether this is a cheaper or a more expensive method is a different issue where the answer changes over time.
CONCLUSION:
The interaction between wind and natural gas is not unknown. However, especially in this winter period, it seems that this effect is important when we examine numerically how the wind supports the natural gas network. While renewable resources are wanted alongside natural gas plants from a grid balance point of view, they nevertheless have a negative impact on their share in the network. Wind and sun influence both demand and production. They affect our perception of air temperature to feel warmer or colder. They reduce the share of base load plants and market prices. Whether this effect is good or bad will continue to be discussed for years to come.