 SUMMARY:
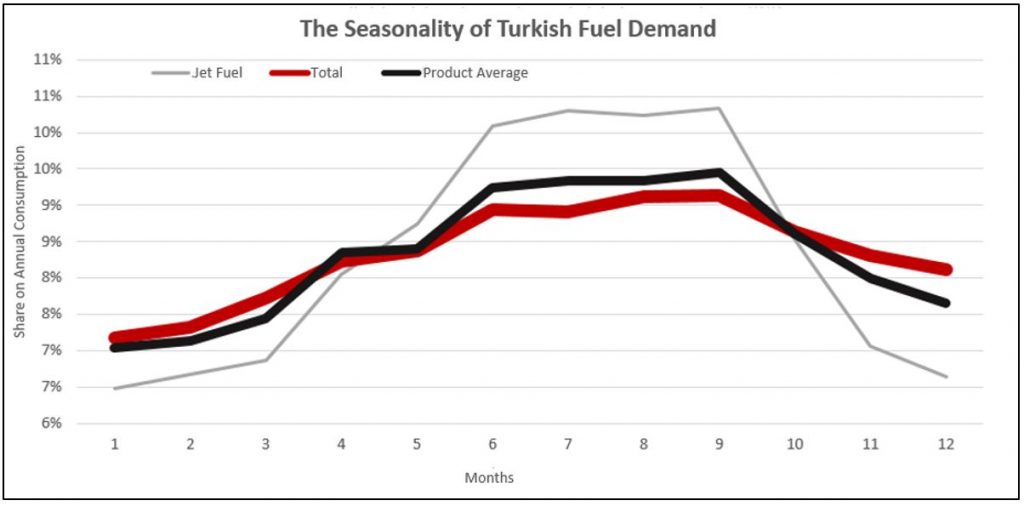
The seasonality of Turkey’s fuel demand is a known fact. It offers a tool for determining what kind of trend the current deficit will adopt, especially in periods where oil prices are on the rise. This Q report aims to calculate the seasonality of the petroleum products. If there is a “driving” – “holiday” season in Turkey, approaching it from two viewpoints: from an all fuel oil products viewpoint and then from land fuels (diesel, gasoline, LPG) viewpoint, can be beneficial. Jet fuels were not included due to their high seasonality.
METHOD:
The data series for the secondary petroleum products was derived from the JODI database – used also by the International Energy Agency – from 2002 to the latest available data of March 2018. The series was first divided into years, allowing for the share of select products in annual consumption to be calculated. In the first graph, the thousand barrels/day data was included directly into the average for “fuel seasonality”. In the second graph, on the other hand, consumption of these products’ in the last 12 months from 2012 and onwards, was demonstrated on a thousand barrels/day basis.
ANALYSIS:
In the first graph, the seasonality was calculated very simply by using the sum total and the calculated data derived from JODI. A boost in demand can be observed in Turkey between the months of June and September. This means oil’s effect on current deficit is much higher in the third quarter of the year.
If we look at what land or road fuels, such as LPG, gasoline and diesel which are heavily used in land transportation, and take their weighed average, they draw wobbly line rather than a linear one. One of the reasons behind it is jet fuels’ strong seasonality.
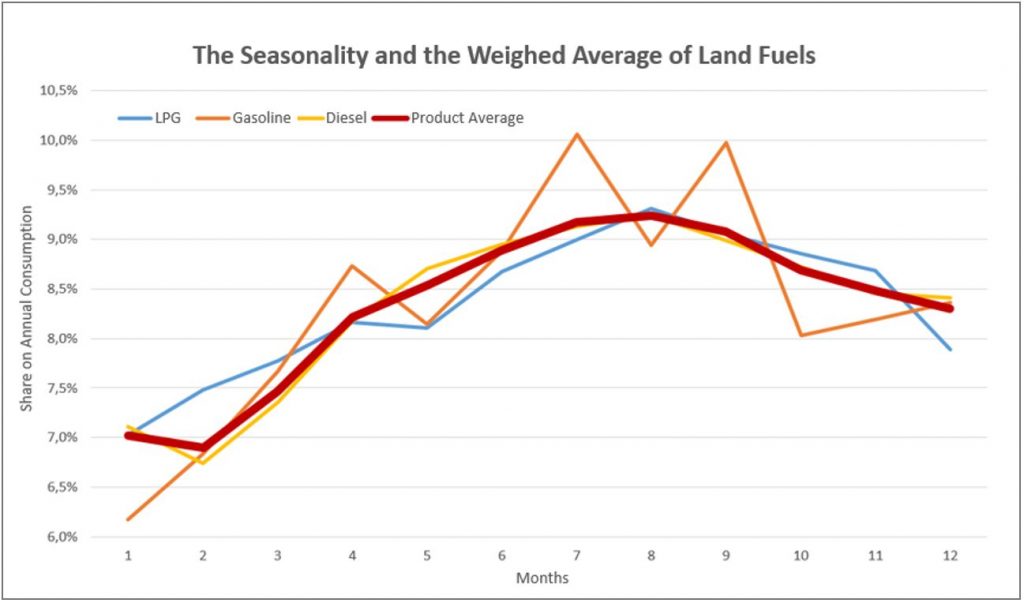
Having the lowest share in the final demand, gasoline shows much sharper transitions (in the period between 2012 – 2017). Religious holidays are the main culprit here as consumption in these periods are wholly removed from transportation and the graph clearly demonstrates their effect. (The share of land fuels was accepted as 8% for gasoline, 20% for LNG and 72% for diesel in the calculations.)
CONCLUSION:
Turkey’s petroleum product demand demonstrates a very clear seasonality. The highest and the lowest demand periods for oil are the 3rd and the 1st quarter respectively. As the increase in the annual demand is evident in the 4th quarter, it is not always accurate to declare winter as the period with the lowest demand.
A low gasoline demand actually assists in distinguishing general activities from that of transportation. A more linear trend can be expected in transportation. However, as a fuel whose consumption is limited only to non-commercial, gasoline shows holidays’ effects rapidly.
Returning to the central question, current deficit will widen in the 3rd quarter. We will see the prices’ true effect on consumption after the 3rd quarter.