 SUMMARY:
When talking about Turkey’s energy policy, what pops into mind might be its electricity policies. Energy policy and the electricity generation policy tend to differ from one another, so a careful appraisal of data may be necessary. While the most important items in energy policies remain fossil fuels; in the case of electricity policies, these are topics such as domestic resources, technological developments, storage systems and market structure. Recently, Turkey had a significant shift in energy demand. As shown in previous Q reports, the main energy expenditure of the mid-class could be petroleum products. We can argue what really drives Turkey’s energy demand is oil and transportation demands. When we step back and look at the picture, however, it may look different.
METHOD:
The data used in the analysis was prepared by compiling the data of 1995, 2000, 2005, 2010, 2015 from the energy balance sheets of the General Directorate of Energy Affairs. Although electricity generation was included directly to conversion sector as positive, a distinction was not made.
ANALYSIS:
A balance chart shows the energy balance of a country. Crude energy sources’ and some renewable sources’ “primary energy supply” are shown in the first row of Table-1. The secondary products produced by conversion from these sources (energy sources which don’t exist on their own in the nature but are supplied for through a process like refining, generation such as electricity, petroleum products, etc.) are given in the “conversion” section, on the second row. Secondary sources produced in this conversion sector and primary sources which are directly consumed are separated according to sectoral consumption in Table-2.
Natural gas, hydroelectric and coal shares in the electricity sector and their graphs are often utilised in energy analysis of Turkey. But the share of electricity, transportation and oil in the total energy consumption is seldom mentioned.
Table-1 and Table-2 are prepared by combining certain parameters from balance sheets. While Table-1 has “mtoe values”, Table-2 shows the “% ratios”. The ratios are in order from top to bottom:
- How much of the primary energy supply goes to the conversion sector
- How much of the primary energy supply is used for electricity generation (in gross terms)
- Ratio of final energy demand to primary resource supply
- The ratios of electricity, transport and petroleum to final energy requirements
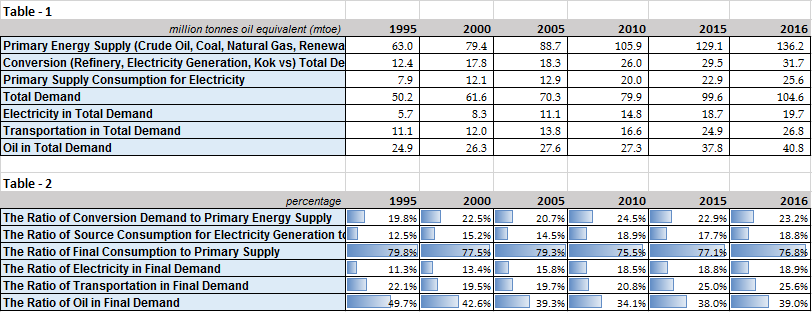
The main reason why the use of resources for electricity differs from year to year is the effect of hydroelectric production. According to the EU and IEA methodology, hydropower productions are considered 100% efficient and the generated electricity is directly equal to the used water power.
After 1995, the share of the conversion sector appears to have increased. As we can all guess, the rate of electricity in final demand can also be seen increasing. The share of electricity in final consumption, which was 11% in 1995, has increased to a 18.9% by 2016 (Figure-1).
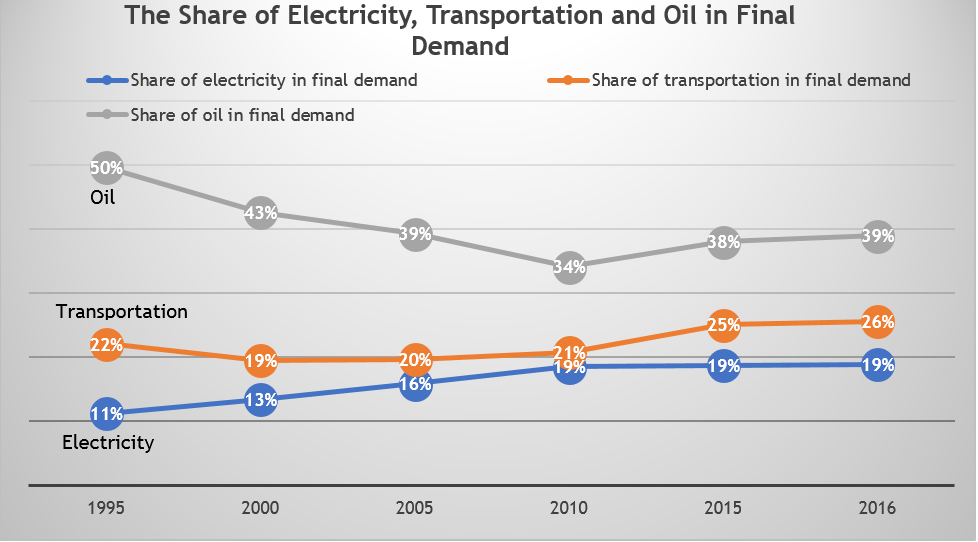
But what is interesting is not that electrification in the energy system has increased. Only about 20% of the final demand is electricity. The remaining 80% are still fossil sources and most of them are direct consumption.
Oil’s share in the final demand, which was 43% in 2000, dropped to 34% in 2010s and have recently risen back to 43% in recent years. Transportation’s share in the final demand has also increased steadily, from 19% in 2000 to 26% in 2016. What is noteworthy here is that both trends have accelerated after 2010. There is an expectation for the falling oil prices to have reversed consumer trends during periods where prices were increasing (2000-2008).
CONCLUSION:
If the priorities of energy policy in Turkey are to be determined according their share, then Turkey’s main energy policy will be oil and gas exploration. In the electricity policy, on the other hand, priority has been given to domestic resources and renewable resources.
A 1000 MW solar panel produces 0.15 mtoe of energy over 1,800 hours annually. In other words, 6461 MW solar panel produces 1 mtoe of energy. This is also equivalent to a daily oil production of 19178 barrels. While oil is mostly used in transportation and petrochemicals, sun is used in electricity generation. So, their lanes are currently separate and as a result, their effect on one another will be low.
The demand for transportation and oil, which had fallen after 2008, have accelerated again, boosting their share in final demand. In previous reports, it was mentioned how consumers’ conviction on the persistence of falling oil prices have turned their preferences towards bigger vehicles. It is also known that the higher profit margins of these vehicles make them attractive to sellers as well. But just as one swallow does not a summer make, it is not wise to trust too much on the fall of oil prices.
In energy priorities, increasing oil demand after 2010 shows no signs of slowing down this year as well. However, priorities may change at any moment.