 SUMMARY:
For a while we have been observing high production figures (not ratios), especially during the weekends, in wind generation. Whilst investigating why these figures coincide with weekends or whether it is a deception or not, a scientific paper published in the American Geophysical Union analysed the weekly cycles of storms in China, their aerosol types and the potential link between them. The paper also mentions how storms in certain regions increase from Friday to Tuesday (page 5). The effects of these aerosols, which are seen more as pollution, may differ. For example, they can have a cooling effect. During certain periods in winter, thermal energy consumption in cities like İzmir is rather high. Do all these factors create a recurrent anomaly in wind generation?
METHOD:
Analyses were made on the Microsoft Azure platform with the dplyr package in R over the wind generation figures in MWh of 2016 and 2017. Excel was then used for visualization purposes. The generation outside of the 1.5 standard deviation (outside of 86%) of the average wind generation over an entire year was cross checked to see if it overlapped in 2016 and 2017. Three different benchmarking factors (days of the month, hours of the day, hours of the month) were used. The day of the week was used rather than the calendar day. Because of the pronounced difference between weekday, weekend and working hours etc. In terms of industry and energy consumption, as described in the above article, three different analysis were derived. If there was a different warming-cooling effect resulting from working hours or weekdays, it should be showing itself as an anomaly in the statistics and repeating in the same way over the years. Our focus lies at not the highest production but the periods that deviate most from average production.
ANALYSIS:
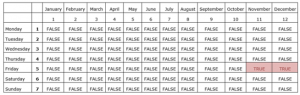
An anomaly can be observed on the Fridays of November and December on the table of days of the week differentiated by months. However, in November this anomaly points to the lowest production whereas in December it points to the highest production.
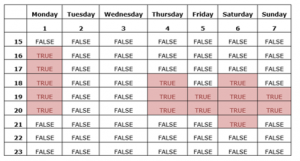
When we approach the days of the week from an hourly perspective, high generation figures can be observed especially in the afternoons. There is a significant positive separation between 16:00 – 20:00 on Mondays. Looking at the year in its entirety (2016 and 2017), 18:00 on Monday is a time frame where wind generation is at its highest in succession in Turkey.
We see a different picture with the statistics in question when we base our approach to the months and hours where the heating load differs.
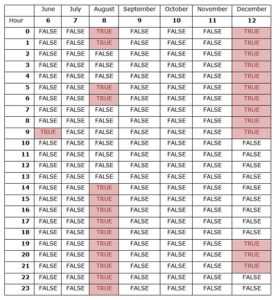
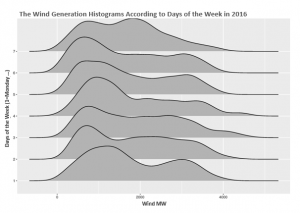
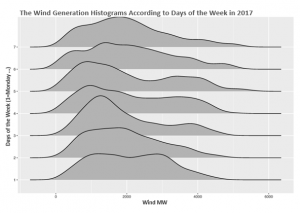
There are figures in December – before sunrise and after sunset – almost the entirety of August and the afternoons in July where the generation can be considered an anomaly (outside of the 1.5 standard deviation). The wind generation histogram for the years 2016 and 2017 according to the days of the week is shown below.
CONCLUSION:
Is wind generation affected by the effects imposed by the industrial community? This is difficult to answer with this simple research, but such a hypothesis is equally difficult to reject. Within one standard deviation, the anomaly is twice as much as in Thursday-Friday-Saturday than Tuesday and Wednesday. A considerable part of the anomalies during the day occurs after 18:00, possibly after sunset. But the confusing point remains still on the table that is; why weekdays seem calmer. Without deeper data and models, it is difficult to go further.