 SUMMARY:
Although not the most popular conversation starter in Turkey, the importance of weather forecast continues to increase. The growing use of smartphones and the rising importance of traffic conditions have both contributed to the reduction of costs associated with access to information. One phrase we hear most often is “In all my time here, never have I seen such a winter”. Does this statement reflect the truth? Sometimes the narrative can go far beyond the reality. For this reason, in this Q report, we will investigate winters of Ankara and İstanbul and seek answers to the questions of basic consumption differences. Although consumption of natural gas increases with temperatures, consumers decrease their consumption to keep their natural gas expenses constant. We have done two separate calculations for this report: the consumption figures according to the per capita annual natural gas consumption and the consumer-heating-degree-per day, that is, consumption according to the cold that a consumer is exposed to.
METHOD:
The data was derived from EMRA’s annual Natural Gas Market Reports, population density data, Turkish Statistical Institute’s per city income figures, population figures and, through degreedays.net, the temperature data from Ankara Esenboğa and İstanbul Atatürk Airports. The space heating in Turkey was assumed to have started below 15.5°C. Firstly, the cooling seasons for Ankara and İstanbul were determined on a yearly basis. Then, the total cooling-degree day was calculated on a calendar year basis. Heating-degree day was calculated by taking the difference in temperatures for each day below 15.5°C. On instances when the air temperature was below zero, for example when the air temperature was -1°C, the heating-degree day is calculated as 15.5-(-1)=16.5°C degree-day. Ankara experiences wider flux in daily temperature differences. While the day-night transition in İstanbul is much softer with the effect of water, cooling occurs much quicker in Ankara. The cumulative degree day, on the other hand, is the day-by-day sum of the difference in degrees that aroused the total need for heating during the entirety of that period.
ANALYSIS:
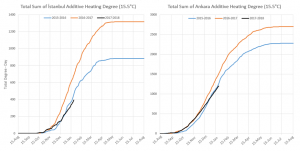
Let us first examine the cumulative heating temperature degrees for the determined “heating period”. The heating season in Ankara starts on September 15 and runs until around May 15. In İstanbul this starts on October 15 and ends around April 15. While this winter began as last year’s, it is more similar to the winter of 2015-2016. The evidence remains insufficient to make exclamations like “too cold” or “too hot” or “winter like never seen before”.
The total heating level in Ankara is almost twice the average of İstanbul (2015-2016-2017). This difference is seen in the left axis. More heating needs are observed in Ankara. On the right axis, when the two graphics show similar lines, it can be observed that winter arrives İstanbul later, whereas it arrives earlier and could stretch all the way to June in Ankara. Shouldn’t therefore an average consumer in Ankara be using twice as much natural gas as İstanbul?
| General Statistics | Natural Gas | ||||||
| Population | Population Density | Income per Capita | Number of consumer households | Household consumption | Consumer/
Population |
Heating degree day | |
| Ankara | 5,34 | 209 | 36.680 | 1,6 | 1,6 | 0,301 | 2544 |
| İstanbul | 14,8 | 2711 | 43.645 | 4,5 | 3,8 | 0,302 | 1134 |
| unit | million | person/km2 | TL/person | Million | billion m3 | degree-day | |
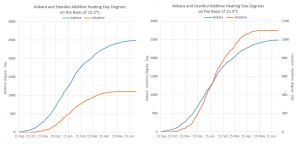
As shown above, at the same penetration rates, while the amount of natural gas consumed per day for 1°C of temperature drop in Ankara is 0.4 m3/consumer-degree-day, in İstanbul, this figure is 0.8 m3/consumer-degree-day.
If we look at consumption per consumer, the figures are around 1000 m3 per consumer in Ankara, whereas they are around 872 m3 in İstanbul.
CONCLUSION:
The winter period starts and ends at different times for Ankara and İstanbul. The colds are longer and stronger in Ankara and much shorter and milder in İstanbul. According to the temperature ratings, the heating demand of İstanbul is almost twice as much as that of Ankara for the same amount of coldness. While an additional 0,4 m3 of natural gas is consumed in Ankara for a 1°C cold in a day, an extra 0.8 m3 of natural gas is consumed for 1°C in İstanbul. If income effect is a factor, while 872 m3 of natural gas is consumed in İstanbul on an annual basis per consumer, 1000 m3 is consumed in Ankara.
Looking at the cumulative colds, it is neither too hot nor too cold this year. At least for now…